
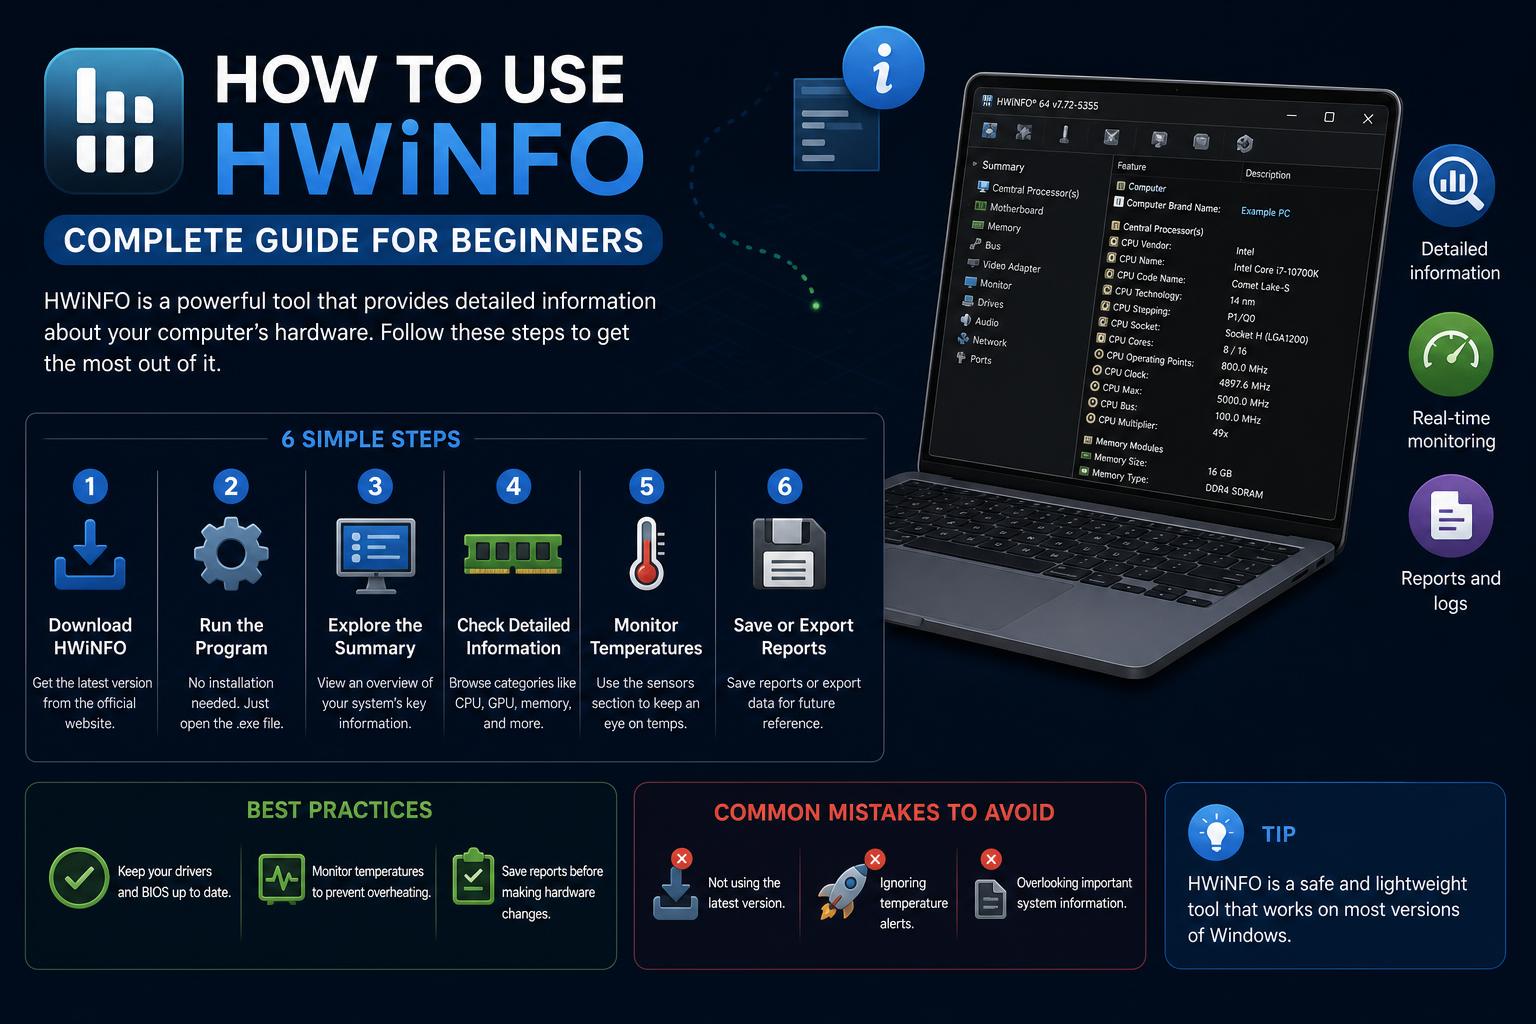
- HWiNFO reveals unmatched, real-time insights into PC hardware, letting users track system health, detect bottlenecks, and prevent thermal issues.
- Focusing on key sensors and effective data logging with HWiNFO provides actionable information for optimizing both gaming and general PC performance.
- Recent overlay features support real-time stats, though the free version has OSD limitations, making tool selection crucial for advanced monitoring.
If you’ve ever opened HWiNFO and felt an immediate wave of confusion at the endless columns of readings and strange abbreviations, you are absolutely not alone. This free utility is one of the most powerful tools for diagnosing your PC, but it’s also notorious for overwhelming even seasoned users with data.
Whether you’re a gamer trying to spot bottlenecks, an overclocker pushing for the perfect tweak, or just a curious enthusiast hoping to keep your hardware healthy, learning how to tame HWiNFO’s data jungle unlocks an entirely new level of control over your computer.
What Exactly Is HWiNFO and Why Should You Care?
HWiNFO, available for free through its official website, is a highly respected hardware monitoring tool. Created by developer Martin Malík, it digs deep into your PC’s hardware to extract and display just about every sensor reading imaginable — from per-core CPU temperatures and usage to GPU statistics, motherboard VRM stats, RAM metrics, and much more.
This is not just any monitoring tool: HWiNFO is routinely used by hardware enthusiasts, competitive gamers, system builders, and technical support pros because of its stunning detail and accuracy. Does that make it intimidating? Sure — but also allows you to spot overheating problems before damage is done, find elusive performance bottlenecks, and precisely track your system’s behavior over time.
Why Gamers and Enthusiasts Turn to HWiNFO
There are plenty of reasons HWiNFO stands out versus well-known utilities like MSI Afterburner or GPU-Z:
- Per-core CPU activity and temperatures: Critical for finding single-thread bottlenecks — something most built-in monitors completely miss.
- Throttling diagnostics: It doesn’t just display that something slowed down, but why — thermal, electrical, or power limits, for instance.
- Detailed GPU monitoring: Including hot spot temperature (vital on modern AMD cards), total power draw, and VRAM usage so you can spot stuttering from texture overflows before it ruins your next match.
- Comprehensive logging: Want a timeline of your hardware’s performance? HWiNFO creates logs in CSV format, perfect for analysis after a gaming session.
The simple truth: monitoring your temperatures and usage in-depth helps extend hardware life and avoid performance killers. HWiNFO simply gives you the full picture.
Downloading and Installing HWiNFO the Right Way
Start by downloading HWiNFO from its . Trusted tech sites like Guru3D also offer safe mirrors. Never download from third-party ‘free download’ websites — they may bundle adware.
You’ll see two main options:
- Installer: For regular, everyday monitoring. It integrates into your system, offers auto-start on boot, and is simple to update.
- Portable: No installation needed — just run the executable. If you’re helping a friend with their PC or want to run diagnostics from a USB stick, this is the way to go.
Once installed, you’ll get a welcome screen with “Sensors Only” and “Summary Only” checkboxes. For your first launch, leave both unchecked to see all available windows. Subsequent times, it’s fastest to use “Sensors Only” so you get straight to the core data.
First-Time Setup: Streamlining Without Losing Essentials
HWiNFO’s forest of readings can seem like overkill, but the magic is in customizing it to fit your needs. Here’s how you should set up for most gamers and everyday users:
- Install and run HWiNFO.
- On the initial window, select “Sensors Only” and click ‘Run’. You’ll arrive at the main Sensors window.
- Open the main Settings. Under the General tab, enable options like “Start with Windows” and “Minimize to Tray on Startup” if you want ongoing monitoring.
- Switch to the Monitoring tab. Disable SMART (disk health) monitoring for your drives: This prevents HWiNFO from waking up sleeping HDDs unnecessarily, which can make the software lighter and your system quieter.
With this configuration, HWiNFO sits quietly in your tray, instantaneously ready if your PC starts acting up or if you need to check temperatures before a high-stakes game.
Understanding HWiNFO’s Layout: Main Windows to Know
When you open HWiNFO, its interface divides primarily into two useful windows:
- System Summary: A high-level dashboard with quick-glance component info and stats, including temperature highlights, clocks, and model information. Great for fast verification that everything is working. Most users only open this briefly.
- Sensors Window: The deep-dive view. Rows and rows display temperatures, voltages, loads, fan speeds, and more, organized by section (CPU, GPU, motherboard, RAM, storage). It’s intimidating, but this is where actual diagnostics happen.
Each section header can be expanded/collapsed by clicking the triangle or arrow to its left. Collapse every section but CPU and GPU to condense things into a quick, focused view. This makes HWiNFO vastly easier to manage and ensures you’re only shown actionable data for gaming or troubleshooting.
Which Sensors Actually Matter? The Key 10 for PC Monitoring
Open HWiNFO and you’ll see hundreds of lines, but you really only need a select few for effective performance monitoring or troubleshooting. Here are the most important ones to keep an eye on:
- CPU Package Temperature: The average temperature across your entire CPU chip. Stick to this reading to gauge overall CPU health during stress (normal: under 80°C for most, up to 90°C for newer chips; 95°C+ is trouble).
- Individual Core Temperatures: Monitoring these tells you if a specific core is getting much hotter than the others, which could signal uneven paste application or a cooling issue.
- Per-core CPU Usage: The secret weapon for bottleneck detection. Task Manager shows an average that may look fine, but if one core sits at 100% here while others sleep, you’ve found a stutter source unique to your system or game.
- CPU Package Power (Watts): This lets you confirm if your CPU is running at its rated TDP or if there’s a limit in place making it underperform.
- GPU Temperature: The baseline for thermal monitoring on your graphics card. Typically should be under 85°C. Higher? Consider cleaning fans or checking case airflow.
- GPU Hot Spot (or Junction) Temperature: Especially important on AMD RDNA2/3/4 cards. This is the max temperature anywhere on the die. Hot spot 90-105°C is expected; above that is a warning to check paste or pads.
- GPU Core Clock (MHz): See if your GPU is boosting as expected. Major falls in clock speed, especially when the temp is steady, usually mean a power draw or TDP limitation, not overheating.
- GPU Load (%): Ideal for figuring out who’s holding back your framerate. 95–100% means the GPU is your limit (time to upgrade the graphics card), while 60–70% with low FPS implies a CPU bottleneck.
- GPU Memory Used (VRAM, MB): If this approaches or exceeds your graphics card’s capacity, you’ll see stuttering as textures swap into much slower system RAM. Dropping texture quality solves this instantly.
- GPU Board Power Draw (Watts): Total power use gives you context. If this is low while GPU Load is also low, that again hints at a CPU bottleneck.
Step-By-Step: Using HWiNFO to Find Bottlenecks and Throttling
To get real value out of HWiNFO, don’t just peek at temperatures. Here’s a process for real-world diagnosis and optimization:
- Open HWiNFO in Sensors Only mode and collapse sections except CPU and GPU.
- If you have a second monitor, drag the Sensors window over and keep it visible while you game or run demanding tasks. Otherwise, prepare to use HWiNFO’s logging feature.
- Play your most demanding game or run a stress test for 15–20 minutes, hitting intense scenes where performance usually lags.
- Watch for signature problem indicators:
- One CPU core at 100%, GPU Load stuck 50–75%, Power Draw lower than expected: Classic CPU bottleneck.
- GPU Load drops suddenly from 99% to 40% and then recovers, matching spikes in GPU temperature: Thermal throttling.
- GPU Core Clock drops but GPU temperature looks normal: Likely a power limit, not temperature.
- GPU Memory Used matches available VRAM: VRAM overflow, stutters from swapping textures.
- AMD GPU Hot Spot above 105°C: Clean/repaste GPU and review case airflow.
This method moves you from guessing at generic temperatures to actively diagnosing—and fixing—real performance problems.
Setting Up Data Logging: Find the Causes You’d Otherwise Miss
It’s common for stutters or throttling to spike briefly and disappear before you even glance at the readings. HWiNFO’s logging feature saves every data point so you can review it all after the fact.
- Open the Sensors window.
- At the bottom, click the small graph icon (the log button).
- Select a save location; HWiNFO will record a CSV file for spreadsheet analysis.
- Run your gaming/test session — 20 to 30 minutes is ideal for catching anything unusual.
- Stop the log, open the CSV in Excel, Google Sheets, or Log Viewer tools.
What should you look for?
- Make charts of GPU Temperature, GPU Core Clock, and GPU Load.
- Compare GPU Load % and individual CPU core usage. Any time GPU Load drops while a single core spikes? There’s proof of a CPU bottleneck.
- Look for sudden drops in clock speed (thermal or power throttling) and any time memory usage maxes out.
[relacionado url=”https://www.ikkaro.net/what-is-flipper-zero/”]
Solving the Most Frequent HWiNFO Challenges
Even with its depth, HWiNFO isn’t immune to quirks or setup obstacles. Here’s how to get past the most common headaches:
1. Sensors window is blank or off-screen
If you launch HWiNFO and the Sensors window is invisible, usually it’s been moved off-screen (maybe you previously used a second monitor that’s now unplugged). Solution: Open HWiNFO’s settings and hit “Reset Preferences.” If that doesn’t work, use the Registry Editor to reset window positions (navigate to HKEY_CURRENT_USER > Software > HWiNFO64 > Sensors and delete WndTopX and WndTopY).
2. FPS drops with HWiNFO open
If your games become choppy only when HWiNFO sensors are active, specific sensors may be to blame — especially disk SMART, Embedded Controller (EC) sensors on ASUS/MSI motherboards, or certain GPU VRM sensors. Solution: Right-click those sensor rows in the Sensors window, choose “Disable Monitoring,” and restart HWiNFO. FPS stability usually returns immediately.
3. Confusion about ‘real’ CPU temperatures
You’ll probably see multiple values: “CPU Package,” “Core #1,” “Tctl,” “CCD1,” etc. For overall health, focus on “CPU Package.” To identify uneven cooling, compare individual “Core #” readings, and ignore “Tctl” if it’s offset for your motherboard. If you have a multi-chiplet Ryzen, CCD temps can be useful, but most users may not need to dive into those details.
4. New (or strange) sensors after a driver update
Driver updates can reveal new motherboard or GPU sensors. If readings seem inaccurate or appear in red, right-click to disable, rename, or adjust their display for clarity.
5. PCIe speed appears lower than expected
If your GPU is running at x8 instead of x16, verify during gaming load—GPU link speeds often downclock at idle. Check your motherboard’s manual—some slots or configurations split lanes, especially with M.2 drives installed. Move your GPU to the primary PCIe slot if needed.
Mastering HWiNFO Overlays: Real-Time In-Game Monitoring
Recent updates have introduced a highly anticipated feature: an in-game overlay (OSD) that allows you to view stats including FPS, temperatures, and more during gameplay.
Setup is simple:
- Right-click a stat in the Sensors window and assign it to the overlay.
- Customize the overlay’s appearance, choosing graphs or numerical displays.
Note: The free version limits the overlay to five data points. For more, the Pro version (starting at $29/year) is required.
For casual monitoring, those five stats—such as GPU temp, CPU load, FPS, VRAM usage, and frame time—may be sufficient. For more extensive overlays, tools like MSI Afterburner paired with RTSS provide unlimited customization without additional cost. Evaluate your needs accordingly.
HWiNFO vs. MSI Afterburner vs. GPU-Z: When to Use Each
Here’s a quick comparison to understand their practical applications:
- HWiNFO: Best for comprehensive, multi-component monitoring, detailed diagnostics, long-term logging, and troubleshooting.
- MSI Afterburner: Ideal for in-game overlays, overclocking, fan control, and real-time monitoring tailored for gamers.
- GPU-Z: Focused on GPU-specific data like BIOS, detailed sensor info, and quick specs for hardware checks or flashing preparations.
Running these tools simultaneously is recommended, as they’re lightweight. Use HWiNFO to diagnose issues, monitor with Afterburner in-game, and consult GPU-Z for detailed GPU info or backups.
Pro Tips and Frequently Missed Tricks in HWiNFO
• Saving sensor profiles: Customize which metrics are visible and set thresholds or color codes for quick reference. Right-click sensors to personalize.
• Importing/Exporting layouts: Save your sensor setups and preferences by backing up configuration files stored in the %appdata% folder for easy recovery or sharing.
• Focus on key sensors when starting out: Don’t overload with all readings at once. Concentrate on the most relevant ones (like temperatures, usage, power) and hide the rest for a streamlined experience.
Troubleshooting PC Issues with HWiNFO
Use HWiNFO’s data to identify common problems:
- Stuttering or frame drops: Log during gameplay, look for GPU dips, CPU core spikes, or VRAM surges to pinpoint bottlenecks or overheating.
- Crashes or shutdowns: Review logs post-stress testing; high temperatures or power spikes often reveal thermal or PSU issues.
- Unusual fan noise without load: Disable disk SMART monitoring if it triggers drive spins; excessive disk checks can cause unwanted noise.
- PCIe lane issues: If the GPU runs at x8 instead of x16, adjust placement or check motherboard configuration, especially with multiple devices installed.
Focusing on relevant sensors and analyzing logs allow precise identification of underlying problems, saving time and reducing guesswork.
Going Further: Integration, Community, and Support
The strength of HWiNFO also derives from its active user community and frequent updates. Access troubleshooting guides, custom dashboards via Rainmeter, or visualizations through HWGV or Log Viewer on the official forum and GitHub. Sharing configs and overlays helps resolve issues faster and customizes your monitoring experience.
Advanced users can synchronize logs during stress tests with game sessions to uncover hidden issues and seek community support via Discord or forums, sharing CSV logs for expert analysis.
Notable Limitations of HWiNFO and How to Overcome Them
HWiNFO offers exhaustive data, but it has some limitations:
- Overlay limitations: The free version restricts on-screen display to five data points. For more, consider the Pro version.
- Lack of shared configuration imports: You will have to manually configure the sensors if you want to replicate another user’s template.
- Extensive logs: It is advisable to start with a few key sensors to avoid data overload and dig deeper only when necessary.
Frequently Asked Questions About HWiNFO and PC Monitoring
Does HWiNFO affect gaming performance? Not at all, only if you activate problematic sensors; these are easily disabled. For most, it runs silently in the background.
Why are there so many temperature values for my CPU and GPU? Because these components have multiple internal sensors. Focus on “CPU Package” and “GPU Hot Spot” for useful information and leave the rest for advanced tuning.
Do I need the Pro version? Only if you need more than five values in the overlay or detailed analysis; it is generally not essential for basic use or logging.
Is it safe to use on laptops? Yes, HWiNFO is ideal for checking temperatures and system health on portable devices.
If a sensor appears in red, is my PC in danger? Not necessarily — it could be a customizable warning or a value only valid in certain scenarios. Check the logs and manufacturer specifications before worrying.
Expert Workflow: Rapid Diagnostics and Optimization with HWiNFO
This method combines the best practices to get the most out of HWiNFO:
- Customize the sensor view: Load the sensors window, collapse unnecessary sections, and hide irrelevant sensors.
- Configure default log recording: Activate the CSV function to capture temporary issues or compare sessions.
- Use the overlay for live monitoring: Add up to five key data points like FPS, CPU usage, GPU temperature, VRAM, and frame time, and adjust according to your needs.
- Analyze logs after use: Review trends in Excel or log apps to detect patterns and hidden problems.
- Consult the community: Use the logs to seek help in forums or Discord, or share them to get expert support.
Adopting this workflow helps reduce errors and data overload, making HWiNFO your ally in performance and early fault detection.
Ultimately, HWiNFO transforms PC monitoring by adapting to your needs. By focusing on key sensors and practicing with tests and logs, you will be able to better understand your system’s behavior and solve problems before they affect your gaming experience or daily work.