
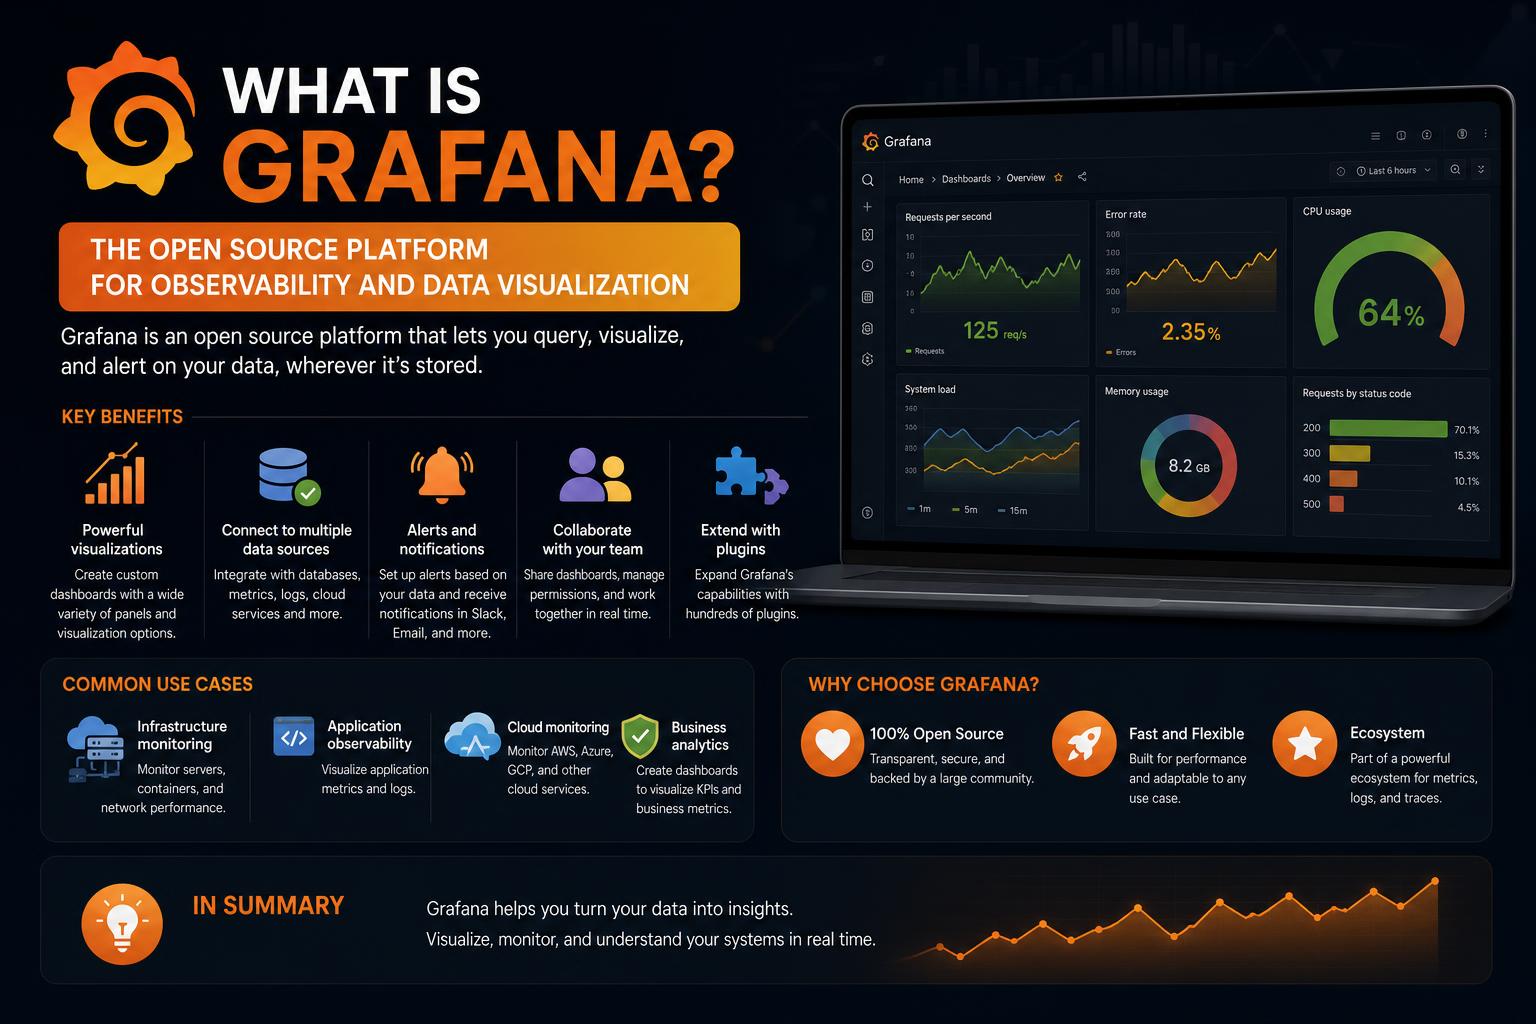
- Grafana is an open-source platform for data visualization and observability, enabling the creation of interactive dashboards from disparate data sources.
- The platform integrates seamlessly with tools like Prometheus, InfluxDB, Loki, and many others, supporting metrics, logs, and traces within a unified interface.
- Its flexibility, extensibility, and robust alerting capabilities make Grafana a favorite for infrastructure, application, and business monitoring at scale.
If you’ve ever tried to keep track of your servers, apps, or business metrics but found yourself drowning in a sea of numbers and logs, you’re not alone. Observability and monitoring are must-haves in today’s fast-moving tech world. But the real challenge isn’t just collecting data—it’s making sense of all that information. That’s exactly where Grafana steps in.
Grafana has rapidly become the leading open-source choice for organizations big and small hoping to visualize, explore, and truly understand their data, wherever it lives. Whether you’re a DevOps pro, a data scientist, or just someone trying to keep an eye on your smart home, Grafana provides the tools to turn raw numbers into clear visuals, track trends, and respond faster to what matters most.
What Actually Is Grafana?
Grafana is an open-source analytics and data visualization web application. Released initially in 2014 by Torkel Ödegaard and now helmed by Grafana Labs, it’s designed to help users monitor metrics, logs, traces, and more—all through highly interactive dashboards.
Grafana does not store your data; instead, it acts as a bridge between your data sources (like Prometheus, InfluxDB, Graphite, Elasticsearch, MySQL, and many others) and interactive dashboards that help you understand what’s going on. You write queries to fetch data from these sources, and Grafana renders the results in real time as charts, graphs, heatmaps, tables, and custom widgets, all organized within easy-to-use dashboards.
A Quick History of Grafana
Grafana was born out of the need to visualize time-series data, especially metrics. It emerged from work on Graphite at Orbitz, and its UI was originally inspired by Kibana. Since its creation, Grafana Labs (formerly Raintank) has raised over $500 million to help evolve the observability ecosystem. The project now boasts a vibrant open-source community and is used by organizations as large as NASA, Wikimedia, Uber, Nvidia, and Anthropic.
In 2021, Grafana switched its core license from Apache 2.0 to AGPLv3. Commercial offerings now include Grafana Cloud for managed deployments and Grafana Enterprise for larger self-managed environments. The underlying vision remains the same: help teams visualize and act on their data faster and more securely.
Main Capabilities of Grafana
At its core, Grafana is about helping teams observe their infrastructure, apps, and business processes through a beautiful, flexible interface. Here’s what makes it shine:
- Rich Visualizations: Choose from line graphs, bar charts, heatmaps, gauges, histograms, tables, and more. Drill down with dynamic variables, use interactive filters, or build complex, multi-source dashboards.
- Customizable Dashboards: Organize information across panels that can be rearranged, resized, and tailored to your workflow. Use templating to make dashboards reusable for different teams, environments, or projects.
- Pluggable Data Source Support: Grafana connects with a huge list of data sources—relational databases like MySQL and PostgreSQL, time-series databases (Prometheus, InfluxDB), log stores (Loki, Elasticsearch), and modern cloud-native sources like AWS CloudWatch, Google Cloud Monitoring, and more. You can even build your own plugins to support custom data systems.
- Real-Time Alerting & Notifications: Set up alert rules for any metric or visualization. If a value is outside expected bounds, instantly notify teams via Slack, PagerDuty, Microsoft Teams, e-mail, and more. Stay ahead of outages or issues before they impact users.
- Annotation, Collaboration, and Tracing: Mark significant events right on your graphs, providing context for data spikes or anomalies. Share dashboards with the team, review history, and even correlate metrics with logs and traces for deep troubleshooting.
- Secure Access Control: Control access with LDAP, OAuth, SAML, and advanced Role-Based Access Controls (RBAC). In Grafana Enterprise, synchronize user teams with your corporate authentication infrastructure.
How Does Grafana Work Behind the Scenes?
Grafana runs as a web application, with a backend written in Go and a frontend in TypeScript (using React). You typically install it as a single binary, which serves the web UI and interacts with external data sources via a robust plugin system.
Dashboards are typically defined as JSON documents. These can be managed through the user interface or provisioned from code (enabling version control and easy environment migrations). When a dashboard loads, Grafana queries the necessary data sources in real time, applies any transformations or filters, and renders the result on your screen.
Key architectural features include:
- Plugin Ecosystem: Extend Grafana with data source plugins (fetching from databases or APIs), panel plugins (custom visualization types), and app plugins (bundling sources, panels, and additional UI together).
- Persistence: Grafana does not store the actual time-series data, logs, or traces. It uses a relational database (SQLite by default, MySQL or PostgreSQL for production) to manage dashboards, user accounts, annotation events, and alert definitions.
Working with Data: From Sources to Dashboards
Making sense of data in Grafana involves a clear, three-step process:
- Connecting Data Sources: Add your preferred storage systems—Prometheus, SQL databases, cloud monitoring APIs, or custom endpoints. Each source hooks in via a dedicated plugin. The plugin is aware of source-specific protocols, authentication, and formats, simplifying complex integrations.
- Writing Queries: Each data source has its own query language or API. Grafana provides an editor tailored to each source—SQL for MySQL, PromQL for Prometheus, Lucene for Elasticsearch, and so on. These queries fetch exactly the metrics or events you want to visualize.
- Transforming Data: Before presenting, Grafana can manipulate the raw query results: you can filter rows, combine multiple queries, perform calculations, or reshape data frames to match your visualization needs—all within the interface.
Once the data is ready, Grafana displays it using an array of panels that you can mix and match on your dashboards.
Highlight: The LGTM Stack and More
Grafana Labs isn’t just about the main Grafana project—it’s also behind several other open-source pillars of observability. Often deployed together, these tools make up what’s known as the LGTM Stack:
- Loki: A log aggregation system optimized for efficiency and scalability, designed to work smoothly with Grafana. Loki doesn’t index full log content, making it fast and storage-efficient.
- Mimir: A powerful, horizontally scalable, multi-tenant time-series database. Designed to offer long-term Prometheus-style metrics storage.
- Tempo: A highly efficient distributed tracing backend, capable of handling huge volumes by storing raw traces in object storage—no indexing required.
- Pyroscope: A continuous profiling database, helping teams understand precisely how their applications consume CPU, memory, and other resources, down to the line of code.
Together with Grafana, these components give teams a single place to analyze metrics, logs, traces, and profiles (the four main pillars of observability).
Even More Open-Source Additions
Grafana Labs continues to invest in new projects to support all observability needs:
- Alloy: The vendor-neutral distributed collector for OpenTelemetry, Prometheus, Loki, Tempo, and Pyroscope telemetry. Replaces the old Grafana Agent, allowing integrated, multi-signal observability pipelines.
- Beyla: An eBPF-based auto-instrumentation tool providing RED (rate, error, duration) metrics and trace spans for HTTP/S and gRPC services running in Linux environments, with no change to your code required.
- Faro: A web SDK for Real User Monitoring (RUM), collecting frontend metrics, exceptions, user events, and client-side traces and correlating them with backend performance data.
- k6: An open-source load and performance testing tool, scripting in JavaScript or TypeScript, widely used for testing infrastructure at scale.
- OnCall: Grafana’s open-source incident response management platform, enabling better collaboration and faster resolutions during outages or incidents.
Main Features You Can’t Ignore
Customizable, Interactive Dashboards
Grafana makes dashboard creation a breeze even for beginners. The drag-and-drop UI, combined with in-depth customization, allows monitoring panels to be tailored for any scenario: infrastructure, application performance, IoT, business intelligence, and more. Use dashboard variables and templating features to quickly flip between datasets or environments without hardcoding panel values.
Alerting That Works for You
Stay on top of things by defining alerts directly on any visualization or metric. Grafana lets you route notifications to dozens of systems (Slack, PagerDuty, Teams, email, and more). Advanced hook support allows integration with practically any incident management tool.
Plugins and Integrations—Endless Extensibility
Grafana’s plugin framework supports both official and community-built plugins. Connect to new data sources, add bespoke visualizations, or bring in services like Jira and GitLab. The ecosystem grows every week, thanks to the passionate open-source community. If you invent a killer dashboard or visualization, you can even share it for others to use and adapt.
Annotations and Collaborative Insights
Add context to your metrics by marking events, outages, or deployments directly on your graphs. Team members can add manual annotations or feed in external event streams (from monitoring systems, issue trackers, or CI/CD tools) to correlate actions with performance changes.
Secure, Scalable Multi-Tenancy
Grafana supports secure multi-tenancy. Create user teams, segment access to dashboards, folders, or even data sources. Grafana Enterprise goes further, letting organizations map internal authentication systems and assign permissions at a granular level.
Installing and Getting Started
Grafana makes it easy to get up and running, no matter your environment. It ships with installers for Linux, macOS, and Windows, and can run on Docker or in the cloud. By default, it launches on port 3000, ready for you to log in and start making dashboards. Once installed, add your data sources, create your first dashboard, and get notified the minute something goes wrong.
Provisioning and Automation
Power users can script the setup process for multiple dashboards or entire environments. Use files or APIs to predefine data sources, dashboards, alert rules, and user access. This is handy when auto-scaling or deploying reproducible monitoring setups (e.g., with Kubernetes or Infrastructure as Code tools).
The Many Use Cases for Grafana
Grafana’s flexibility opens it up to a dizzying number of monitoring scenarios:
- Infrastructure Monitoring: Track CPU, memory, disk, and network metrics across servers, VMs, or cloud services. Proactively spot outages, bottlenecks, or anomalies.
- Application Performance: Connect with tools like Prometheus, Jaeger, or AppDynamics to visualize key metrics like response times, error rates, and user experience.
- Log Analytics: Integrate log stores like Loki or Elasticsearch to bring together logs, metrics, and events within a single dashboard for rapid troubleshooting.
- IoT and Sensor Data: Visualize data streaming from IoT sensors, manufacturing lines, or home automation systems by connecting InfluxDB, MQTT brokers, or even Google Cloud Monitoring.
- Security Engineering: Monitor security metrics and compliance, aggregating SIEM data and logging suspicious activity in real time.
- Cloud Service Monitoring: Pull metrics directly from AWS CloudWatch, Azure Monitor, or Google Cloud Monitoring. Combine with on-premises metrics and compare service health across environments.
- Business Intelligence: Use SQL connections to visualize business metrics like KPIs, sales, and customer engagement on fully customizable dashboards.
Key Steps in Using Grafana
- Install Grafana: Choose your platform and follow the documentation. Docker images are available for cloud or containerized setups.
- Connect Data Sources: Use the plugin interface, enter credentials or endpoints, and hook into virtually any database, API, or cloud service.
- Create and Layout Dashboards: Utilize the drag-and-drop editor, add panels, define queries, and personalize visualizations. Use variables and templating for flexibility.
- Set Alert Rules and Channels: Overlay threshold-based monitoring, configure notifications, and automate incident response.
- Secure and Manage Access: Activate authentication, enable HTTPS, and use RBAC to control who sees what.
Enterprise Features and Cloud Hosting
For larger organizations or regulated industries, Grafana delivers several advanced solutions:
- Grafana Cloud: Hosted as a managed service, combines all the core observability tools (Grafana, Loki, Mimir, Tempo, Pyroscope) with features like Adaptive Telemetry and AI-powered observability workflows via Grafana Assistant.
- Grafana Enterprise: Self-managed stack, includes advanced capabilities like team synchronization, granular reporting, enhanced alert management, and deeper integrations with enterprise authentication and authorization systems.
- Grafana OnCall: Manage on-call schedules, automate escalations, and streamline incident response—reducing manual toil and improving collaboration under pressure.
Benefits of Using Grafana
The rise of Grafana is equally about features and flexibility:
- Data Unification: Bring together dozens of sources in a single, unified interface.
- Rapid Troubleshooting: Overlay metrics, logs, and traces for a holistic, root-cause-driven approach to incidents.
- Collaboration: Share dashboards, set permissions, keep audit trails, and maintain context with event annotations.
- Customizability: Adapt dashboards for specific needs—business teams need different views than engineers, and Grafana allows both to coexist.
- Extensibility via Plugins: Hundreds of plugins (data, visualization, integrations) ensure you can grow Grafana as your needs evolve.
- Active Community and Updates: Grafana is constantly evolving, with countless resources, tutorials, forums, and conference videos to tap into.
Frequently Asked Questions about Grafana
Is Grafana Actually Free?
Yes, Grafana’s open-source edition (Grafana OSS) is licensed under AGPLv3 and can be used at no cost. For organizations with complex needs, Grafana Cloud and Grafana Enterprise offer paid, commercial solutions with additional features and support.
What’s the Difference Between Grafana, Grafana Enterprise, and Grafana Cloud?
– Grafana OSS: The fully open-source core platform—100% free and community supported.
– Grafana Enterprise: Adds enhanced security, compliance, scalability, and advanced management tools for large organizations.
– Grafana Cloud: Fully managed, hosted Grafana plus all supporting observability services, with seamless upgrades and continuous operations.
How Is Grafana Used With Prometheus?
Grafana is often paired with Prometheus as its front-end visualization layer. Prometheus scrapes and stores metrics; Grafana queries Prometheus and displays the results as interactive dashboards, allowing organizations to track infrastructure health, latency, and performance in real time.
Does Grafana Store Data?
No, Grafana does not store the actual metrics, logs, or traces it visualizes. It only keeps dashboard definitions, user data, configurations, and alerting metadata in a relational database.
Real-World Adoption
Grafana is widely deployed across industries: Wikimedia, NASA, the Tour de France, Nvidia, Uber, and thousands of others use it every day to gain visibility, spot trends, and respond to incidents before they spiral.
Grafana has established itself as the central piece in modern observability stacks thanks to its flexibility, open-source spirit, extensibility, and wide ecosystem of supporting tools. Whether you’re tracking a handful of VMs on your homelab, running massive cloud infrastructure, or managing critical business KPIs, Grafana brings all your data together, empowering you to monitor, analyze, and react with accuracy and speed. From customizable dashboarding to deep integrations, real-time alerts, and a passionate global community, it’s no wonder so many teams now consider Grafana an essential part of their toolbox. If you haven’t tried Grafana yet, jump in—the open-source core means there’s no barrier to entry, and the resources to learn are everywhere.